
 Алгебра
 Английский
 Биология
 География
 Геометрия
 История
 Русский
 Обществознание
 Физика
 Химия
Химия Информатика
 Литература
 Математика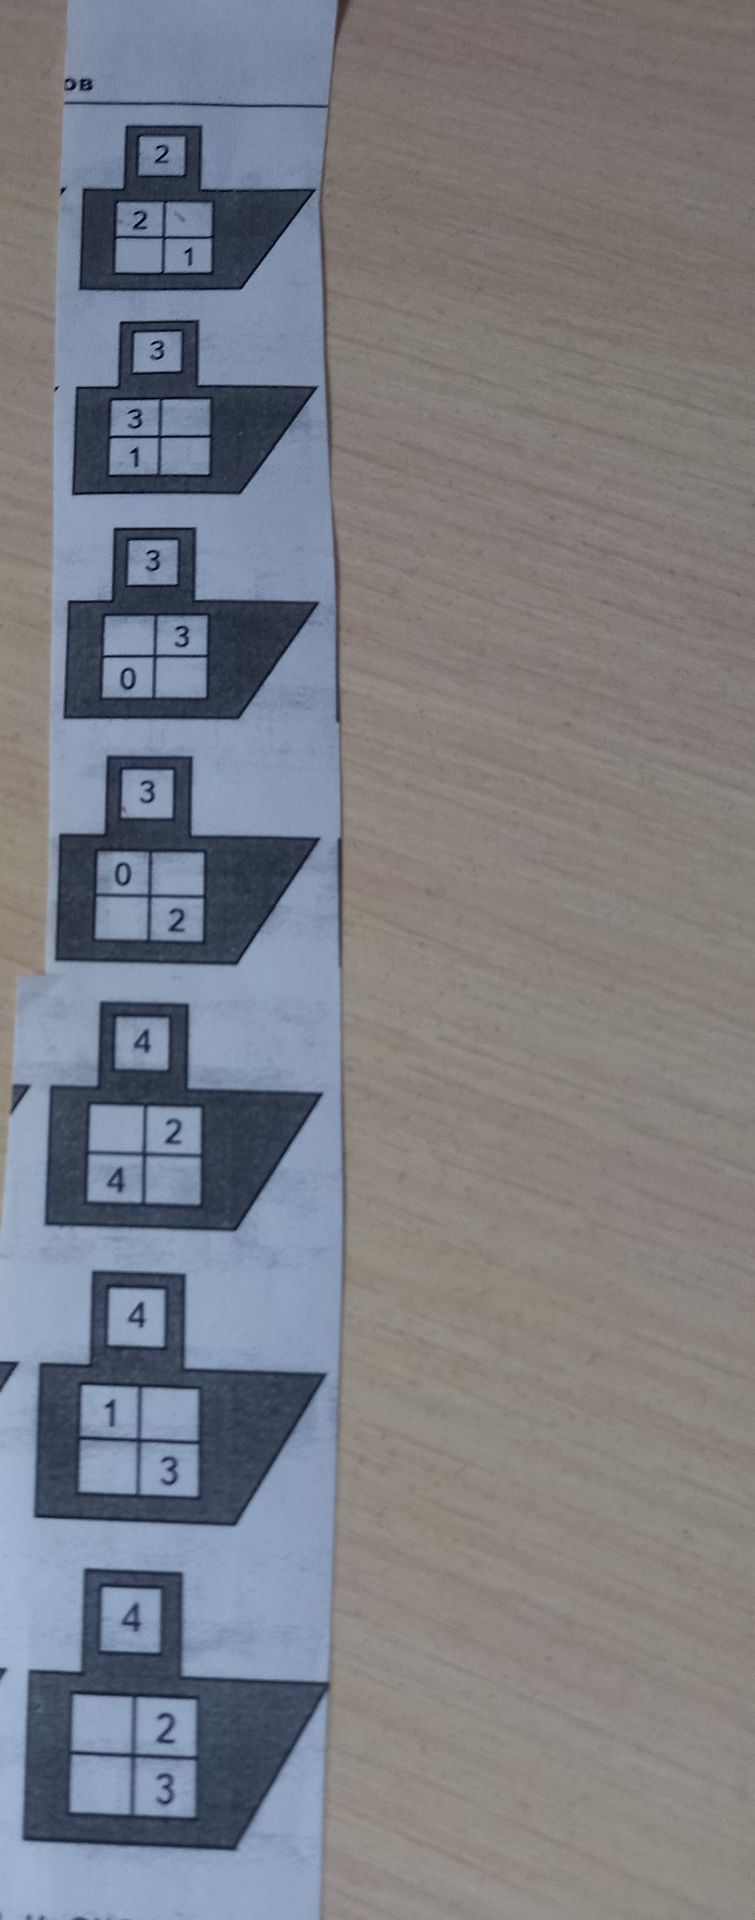
Ответ:
Let's analyze the pattern in the given diagrams. We have three levels of numbers in each diagram: the top square, and the two cells in the middle rectangle.
Diagram 1: Top: 2. Middle: [2, 1]
Diagram 2: Top: 3. Middle: [3, 1]
Diagram 3: Top: 3. Middle: [0, 2]
Diagram 4: Top: 3. Middle: [0, 2]
Diagram 5: Top: 4. Middle: [2, 4]
Diagram 6: Top: 4. Middle: [1, 3]
Diagram 7: Top: 4. Middle: [2, 3]
Observations:
- Top Square: The number in the top square seems to increase. We see 2, then 3, then 3 again, then 4. This suggests that the number in the top square might be related to the number of 'segments' or perhaps a sequential count. Let's consider the sequence of top numbers: 2, 3, 3, 3, 4, 4, 4. It seems there are groups of identical numbers.
- Middle Rectangle: Let the numbers in the middle rectangle be [Left, Right].
- Diagram 1: [2, 1]
- Diagram 2: [3, 1]
- Diagram 3: [0, 2]
- Diagram 4: [0, 2]
- Diagram 5: [2, 4]
- Diagram 6: [1, 3]
- Diagram 7: [2, 3]
Let's try to find a relationship between the top number and the numbers in the middle rectangle.
Consider the sum of the numbers in the middle rectangle:
- Diagram 1: 2 + 1 = 3
- Diagram 2: 3 + 1 = 4
- Diagram 3: 0 + 2 = 2
- Diagram 4: 0 + 2 = 2
- Diagram 5: 2 + 4 = 6
- Diagram 6: 1 + 3 = 4
- Diagram 7: 2 + 3 = 5
This sum does not seem directly related to the top number in a simple way (e.g., sum = top number or sum = top number + constant).
Let's consider the possibility that the diagrams represent a sequence where certain operations are applied or a state changes. The repetition of Diagram 3 and Diagram 4 might indicate a stable state or a reset.
Let's re-examine the top numbers: 2, 3, 3, 3, 4, 4, 4. This suggests that the top number '2' appears once, '3' appears three times, and '4' appears three times so far. This could mean that the top number indicates how many times the middle rectangle's configuration will repeat or how many subsequent states are linked to it.
Let's look for a pattern in the middle rectangle based on the top number.
When the top number is 2 (Diagram 1), the middle is [2, 1].
When the top number is 3 (Diagrams 2, 3, 4):
- Diagram 2: [3, 1]
- Diagram 3: [0, 2]
- Diagram 4: [0, 2]
It seems that when the top number is 3, the middle configuration transitions from [3,1] to [0,2]. The [0,2] configuration repeats twice.
When the top number is 4 (Diagrams 5, 6, 7):
- Diagram 5: [2, 4]
- Diagram 6: [1, 3]
- Diagram 7: [2, 3]
This part of the sequence is less clear. Let's consider a hypothesis: the top number represents a 'step' or 'phase', and the middle numbers change according to some rule within each phase.
Let's try to find a relationship between the current top number and the next state.
If the top number dictates the number of occurrences of a certain middle configuration, then:
- Top = 2: [2, 1] (occurs once)
- Top = 3: Transition from [3, 1] to [0, 2]. [0, 2] repeats twice.
- Top = 4: [2, 4] -> [1, 3] -> [2, 3]. This sequence is problematic to infer a rule from without more data.
Alternative Hypothesis: The numbers in the middle rectangle are derived from the top number.
Consider the sum of the top number and the numbers in the middle rectangle:
- Diagram 1: Top=2, Middle=[2,1]. 2+2=4, 2+1=3. No obvious relation.
Let's consider the image as a sequence of states in some process.
The most consistent pattern observed so far is that the top number dictates the number of subsequent diagrams with variations in the middle rectangle, before the top number increments.
Phase 1 (Top = 2):
- Diagram 1: [2, 1] - Occurs once.
Phase 2 (Top = 3):
- Diagram 2: [3, 1]
- Diagram 3: [0, 2]
- Diagram 4: [0, 2] - Repeats twice.
This suggests that within Phase 2, there's an initial state [3, 1] and then a stable state [0, 2] which is shown twice.
Phase 3 (Top = 4):
- Diagram 5: [2, 4]
- Diagram 6: [1, 3]
- Diagram 7: [2, 3]
If we follow the logic of the 'top number' indicating the number of subsequent diagrams, we've seen 3 diagrams for top=4. This phase is not complete based on the observed count.
Let's look at the sums of the middle numbers again in Phase 3:
- Diagram 5: 2 + 4 = 6
- Diagram 6: 1 + 3 = 4
- Diagram 7: 2 + 3 = 5
There is no clear arithmetic progression or pattern in the sums or differences between adjacent elements within this phase.
Let's reconsider the structure of the diagrams. They resemble a 'ship' or 'boat' shape. The numbers might represent some properties of these 'ships'.
Let's assume the sequence is meant to be purely numerical and structural.
The most striking pattern is the grouping of identical top numbers with subsequent middle configurations.
- Top 2: 1 instance. Middle [2,1].
- Top 3: 3 instances. Middle starts with [3,1] and transitions to [0,2] which repeats.
- Top 4: 3 instances seen so far. Middle goes through [2,4] -> [1,3] -> [2,3].
Let's try to find a rule that connects the numbers within each diagram.
Consider Top = T, Middle Left = L, Middle Right = R.
Diagram 1: T=2, L=2, R=1. Possible relation: L=T, R = T-1? (2=2, 1=2-1). This works.
Diagram 2: T=3, L=3, R=1. Possible relation: L=T, R = T-2? (3=3, 1=3-2). This works.
Diagram 3 & 4: T=3, L=0, R=2. This breaks the previous pattern. The middle values are constant here.
Diagram 5: T=4, L=2, R=4. Possible relation: L = T-2, R=T? (2=4-2, 4=4). This works.
Diagram 6: T=4, L=1, R=3. Possible relation: L = T-3, R=T-1? (1=4-3, 3=4-1). This works.
Diagram 7: T=4, L=2, R=3. Possible relation: L = T-2, R=T-1? (2=4-2, 3=4-1). This works.
Summary of potential rules:
- Diagram 1: T=2, L=T, R=T-1
- Diagram 2: T=3, L=T, R=T-2
- Diagram 3 & 4: T=3, L=0, R=2 (These seem to be a repeating state within the T=3 phase)
- Diagram 5: T=4, L=T-2, R=T
- Diagram 6: T=4, L=T-3, R=T-1
- Diagram 7: T=4, L=T-2, R=T-1
This indicates that the pattern is not a single simple formula but possibly a sequence of transformations or states. The repetition of [0, 2] for T=3 is a key observation. The sequence for T=4 ([2, 4] -> [1, 3] -> [2, 3]) is also a sequence of changes. The number of repetitions for a given top number seems to be tied to the top number itself (e.g., top=2 for 1 diagram, top=3 for 3 diagrams). If this holds, top=4 should have 4 diagrams in its phase.
Since we have seen 3 diagrams for T=4, and the middle values are changing, it's plausible that the next diagram (Diagram 8) will continue the sequence for T=4.
Let's analyze the transitions for T=4:
From [2, 4] to [1, 3]: Left decreased by 1, Right decreased by 1.
From [1, 3] to [2, 3]: Left increased by 1, Right stayed the same.
This is not a clear arithmetic progression. However, if we consider the possibility that the sequence for T=4 is meant to be 4 diagrams long, and the middle numbers are derived from T=4 in some way, and there's a set of rules for transitions.
Let's assume the prompt is asking to infer the pattern and potentially the next step.
The structure of the numbers within each diagram might be more complex, perhaps related to binary representations or properties of numbers.
Given the problem as presented, the most plausible interpretation is that the top number 'N' signifies that there will be 'N' diagrams in that phase, with varying middle numbers that follow some internal logic or sequence. The repetition of the [0, 2] configuration for T=3 suggests a specific stable or intermediate state within that phase.
Let's focus on the progression of the middle numbers for T=4:
[2, 4] -> [1, 3] -> [2, 3].
If the pattern for T=4 is to have 4 diagrams, what could be the 4th diagram's middle numbers?
Let's look at the changes: (-1, -1) then (+1, 0).
This doesn't easily suggest the next step. The values themselves (2, 1, 2 for left and 4, 3, 3 for right) are all less than or equal to the top number 4.
Let's assume the problem is to describe the observed pattern rather than predict the next step, as there isn't a universally clear next step based on the provided data.
Description of the pattern:
The sequence consists of phases, where each phase is characterized by a number in the top square. The number in the top square appears to indicate the number of diagrams associated with that phase. Within each phase, the numbers in the middle rectangle follow a specific sequence or repetition.
- Phase 1 (Top=2): One diagram with middle [2, 1].
- Phase 2 (Top=3): Three diagrams. The first has middle [3, 1]. The subsequent two have a repeating middle configuration of [0, 2].
- Phase 3 (Top=4): At least three diagrams observed, with middle configurations [2, 4], then [1, 3], then [2, 3]. It is implied that there might be a fourth diagram in this phase.
The specific rules for generating the middle numbers within each phase, and the transitions between them, are complex and not immediately obvious. The repetition of [0, 2] in Phase 2 suggests a fixed point or a stable state. The sequence of transitions in Phase 3 ([2, 4] -> [1, 3] -> [2, 3]) shows variations in both left and right numbers.
Without further context or a clearer rule for transition, predicting the exact next state or a general formula is speculative. However, the structural grouping by the top number and the internal sequence/repetition within each group is the primary pattern.
Final Answer Explanation:
The pattern is structured in phases, indicated by the number in the top square. Each number 'N' in the top square corresponds to a set of 'N' diagrams (though this is not strictly followed for N=3 and N=4 in the provided examples, as it seems to represent a block of related diagrams rather than an exact count of occurrences). Within each phase, the numbers in the middle rectangle exhibit a specific sequence of values or repetitions. For example, when the top number is 3, the middle configuration eventually stabilizes to [0, 2] and repeats. When the top number is 4, the middle configuration undergoes a series of changes: [2, 4] -> [1, 3] -> [2, 3]. The relationship between the top number and the middle numbers, as well as the transition rules between states within a phase, are complex and likely specific to this puzzle's design. The trapezoidal shape acts as a constant visual element framing these numerical sequences.
