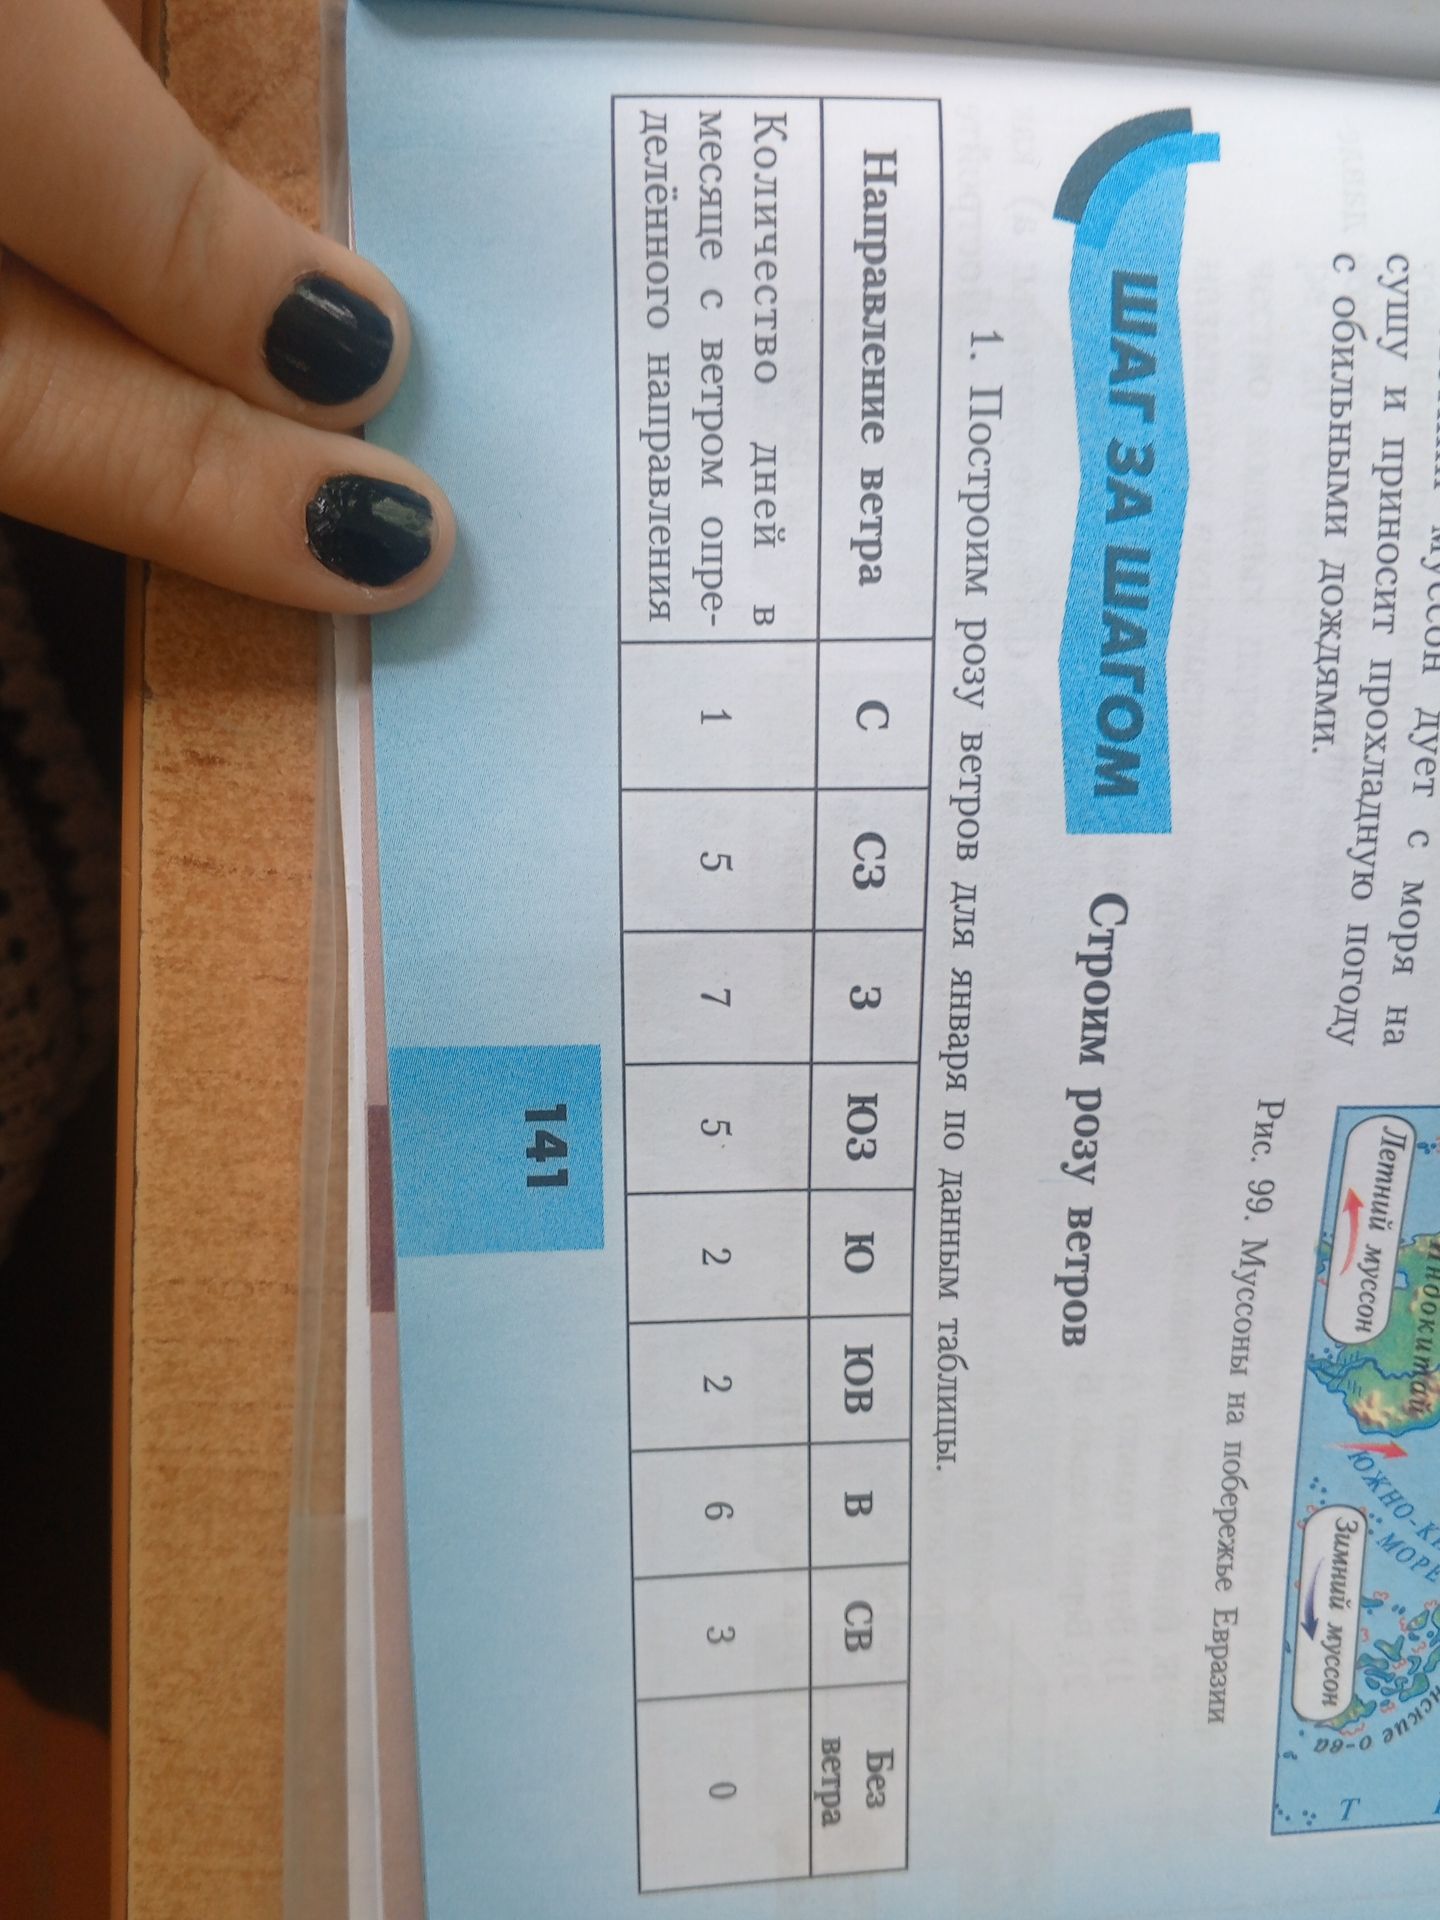
The user has provided an image of a table containing data about wind directions and the number of days with wind from a specific direction in a month. The user also provided a map related to monsoons and text discussing them. The task is to analyze this data and present it in a structured format. The table has columns for 'Направление ветра' (Wind Direction) and 'Количество дней в месяце с ветром определённого направления' (Number of days in the month with wind from a specific direction).
The wind directions listed are: C, C3, 3, ЮЗ, Ю, ЮВ, B, CB, Без ветра.
The corresponding number of days are: 1, 5, 3, 7, 5, 2, 2, 6, 0.
There is also a header 'Строим розу ветров' (Building a wind rose) and a subheading '1. Построим розу ветров для января по данным таблицы.' (1. Let's build a wind rose for January using the table data).
The question is to analyze this data and potentially construct a wind rose or present the data in a clear format. Given the constraints, I should extract the data from the table and present it.

 Алгебра
 Английский
 Биология
 География
 Геометрия
 История
 Русский
 Обществознание
 Физика
 Химия
Химия Информатика
 Литература
 Математика