
 Алгебра
 Английский
 Биология
 География
 Геометрия
 История
 Русский
 Обществознание
 Физика
 Химия
Химия Информатика
 Литература
 Математика
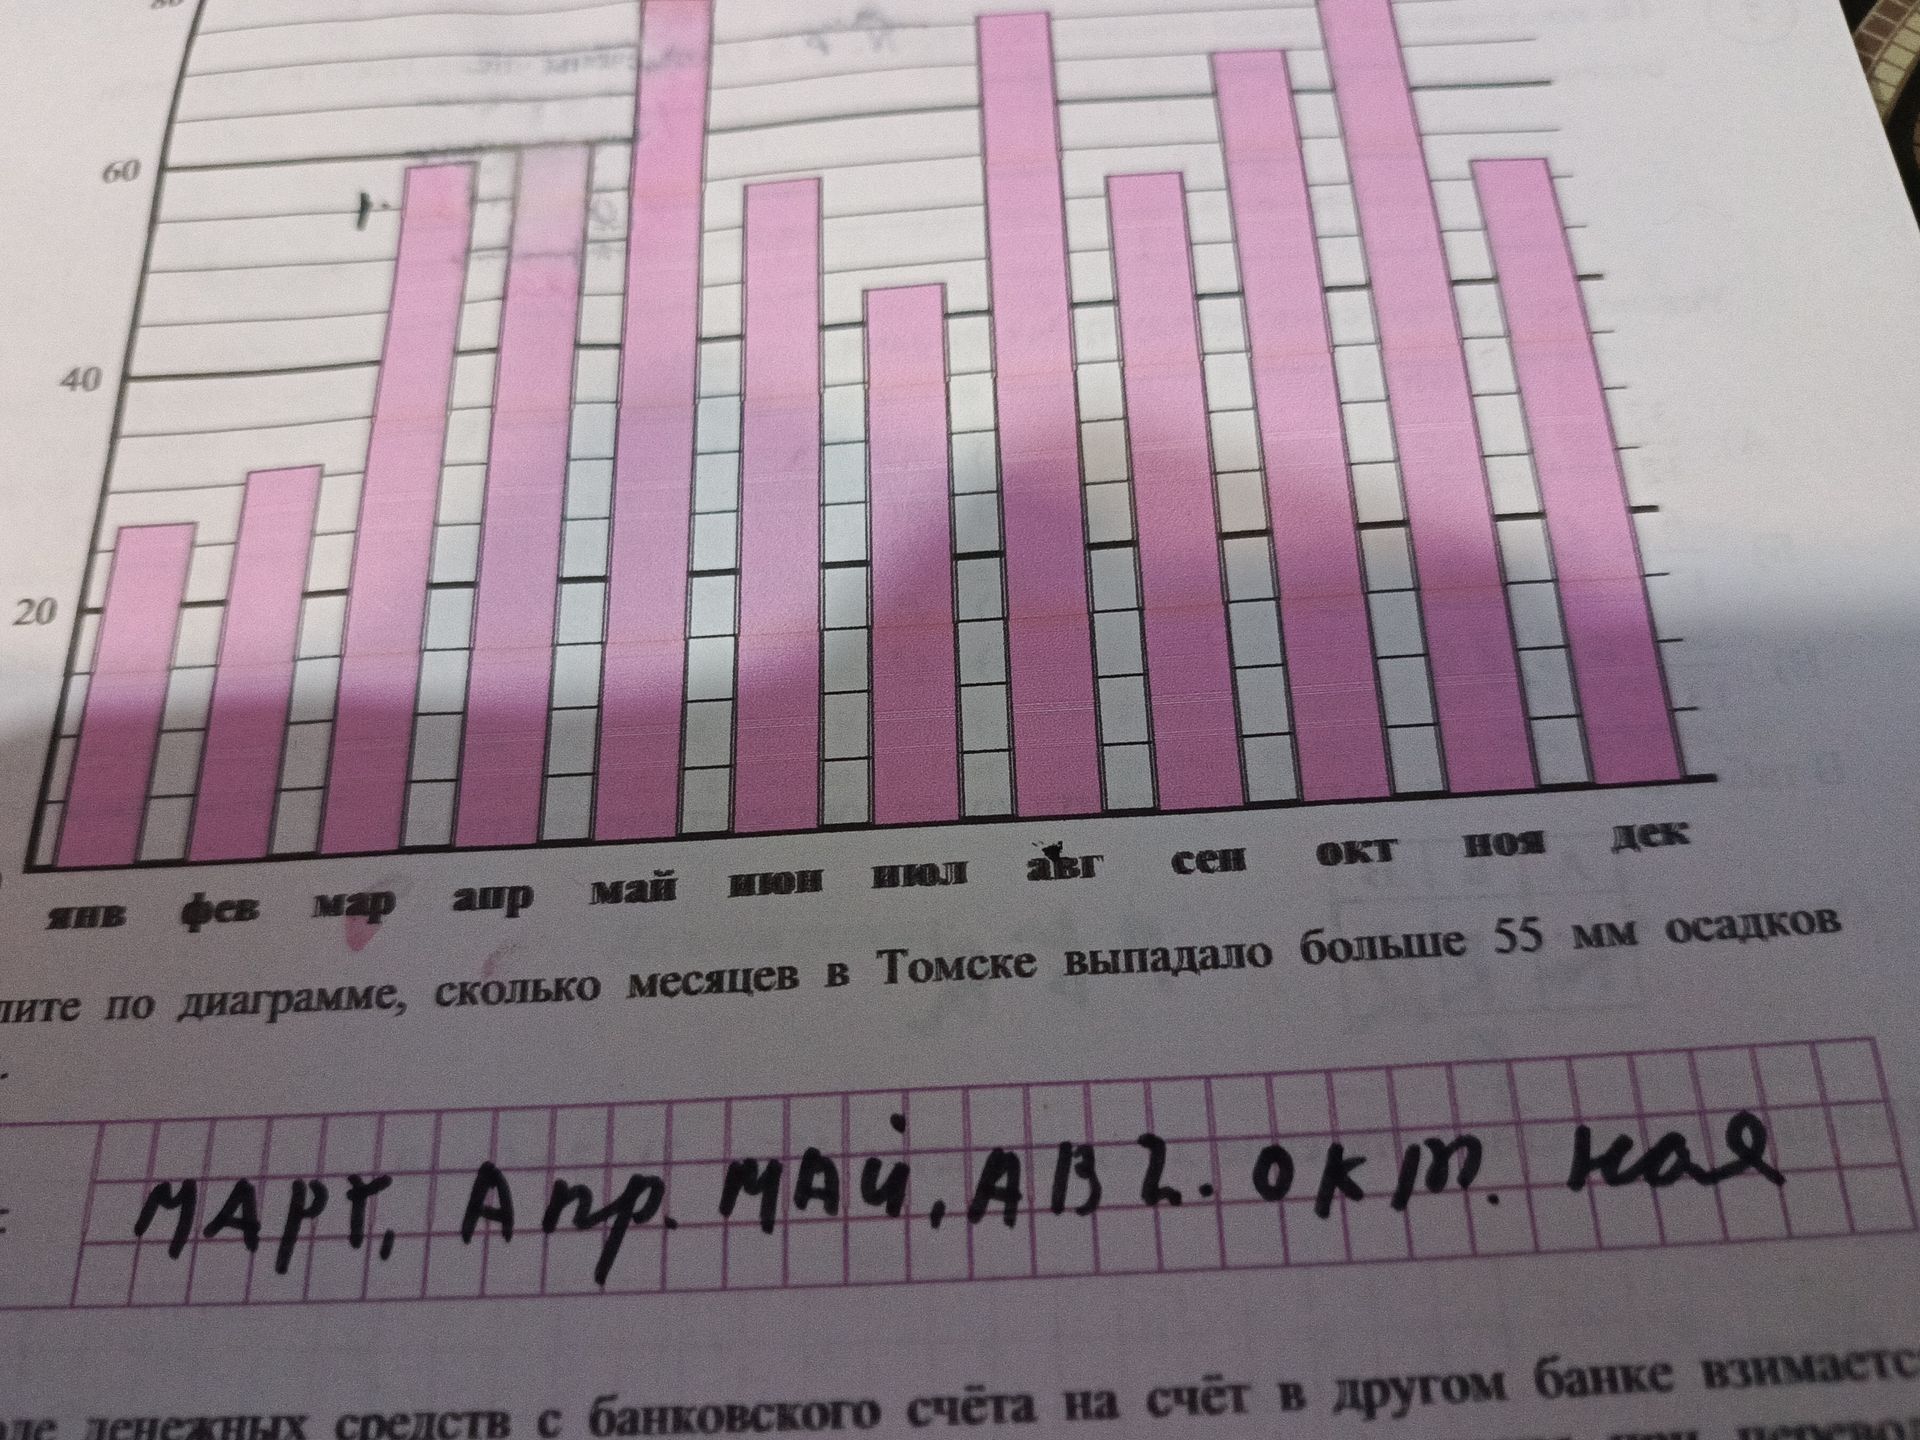
Please count the number of months where Tomsk received more than 55 mm of precipitation.
Ответ:
Analysis of the bar chart:
The bar chart shows precipitation in Tomsk for different months. The vertical axis represents precipitation in mm, and the horizontal axis represents the months of the year (ЯНВ - January, ФЕВ - February, МАР - March, АПР - April, МАЙ - May, ИЮН - June, ИЮЛ - July, АВГ - August, СЕН - September, ОКТ - October, НОЯ - November, ДЕК - December).
We need to identify the months where the precipitation bar is above the 55 mm line.
Looking at the chart:
- The bar for МАР (March) is slightly above 55 mm.
- The bar for АПР (April) is approximately 60 mm.
- The bar for МАЙ (May) is approximately 62 mm.
- The bar for ИЮН (June) is approximately 58 mm.
- The bar for ИЮЛ (July) is approximately 65 mm (the highest).
- The bar for АВГ (August) is approximately 60 mm.
- The bar for ОКТ (October) is approximately 57 mm.
The months with more than 55 mm of precipitation are March, April, May, June, July, August, and October.
Let's count them: 1 (March) + 1 (April) + 1 (May) + 1 (June) + 1 (July) + 1 (August) + 1 (October) = 7 months.
The written answer below the chart lists: МАРТ, Апр. МАЙ, AB2.0km. ная. This seems to be an incomplete or incorrect attempt to answer the question. The OCR also shows "АВГ" which is August.
Based on the visual data from the bar chart, there are 7 months with precipitation exceeding 55 mm.
Answer: 7 месяцев
