Вопрос:
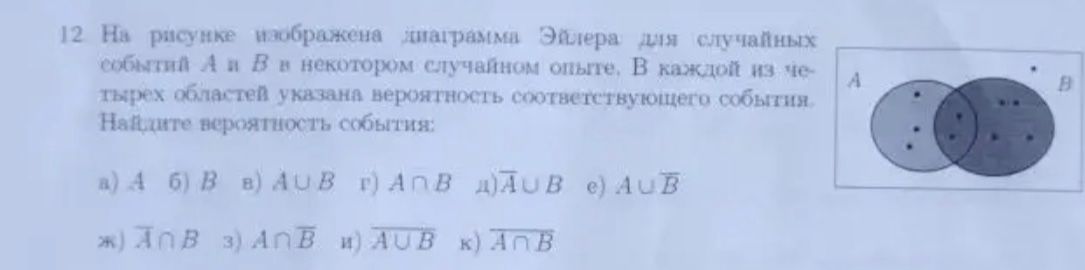
12. На рисунке изображена диаграмма Эйлера для случайных событий А и В в некотором случайном опыте. В каждой из четырех областей указана вероятность соответствующего события. Найдите вероятность события:
Ответ:
The image displays a Venn diagram for events A and B. The probabilities for each of the four regions are indicated. The question asks to find the probability of various events. However, the specific probabilities for each region are not provided in the image, making it impossible to calculate the probabilities of the listed events (a) A, б) B, в) AUB, г) АПВ, д) АИВ, е) AUB, ж) ΑΠΒ, з) АПВ, и) AUB, к) АВ).
